Cart

Your cart is currently empty.

Sub Total: 0.00

Category: Data Analytics

Data Analytics vs Business Analytics: The Difference

Data Analytics vs Business Analytics: The Difference

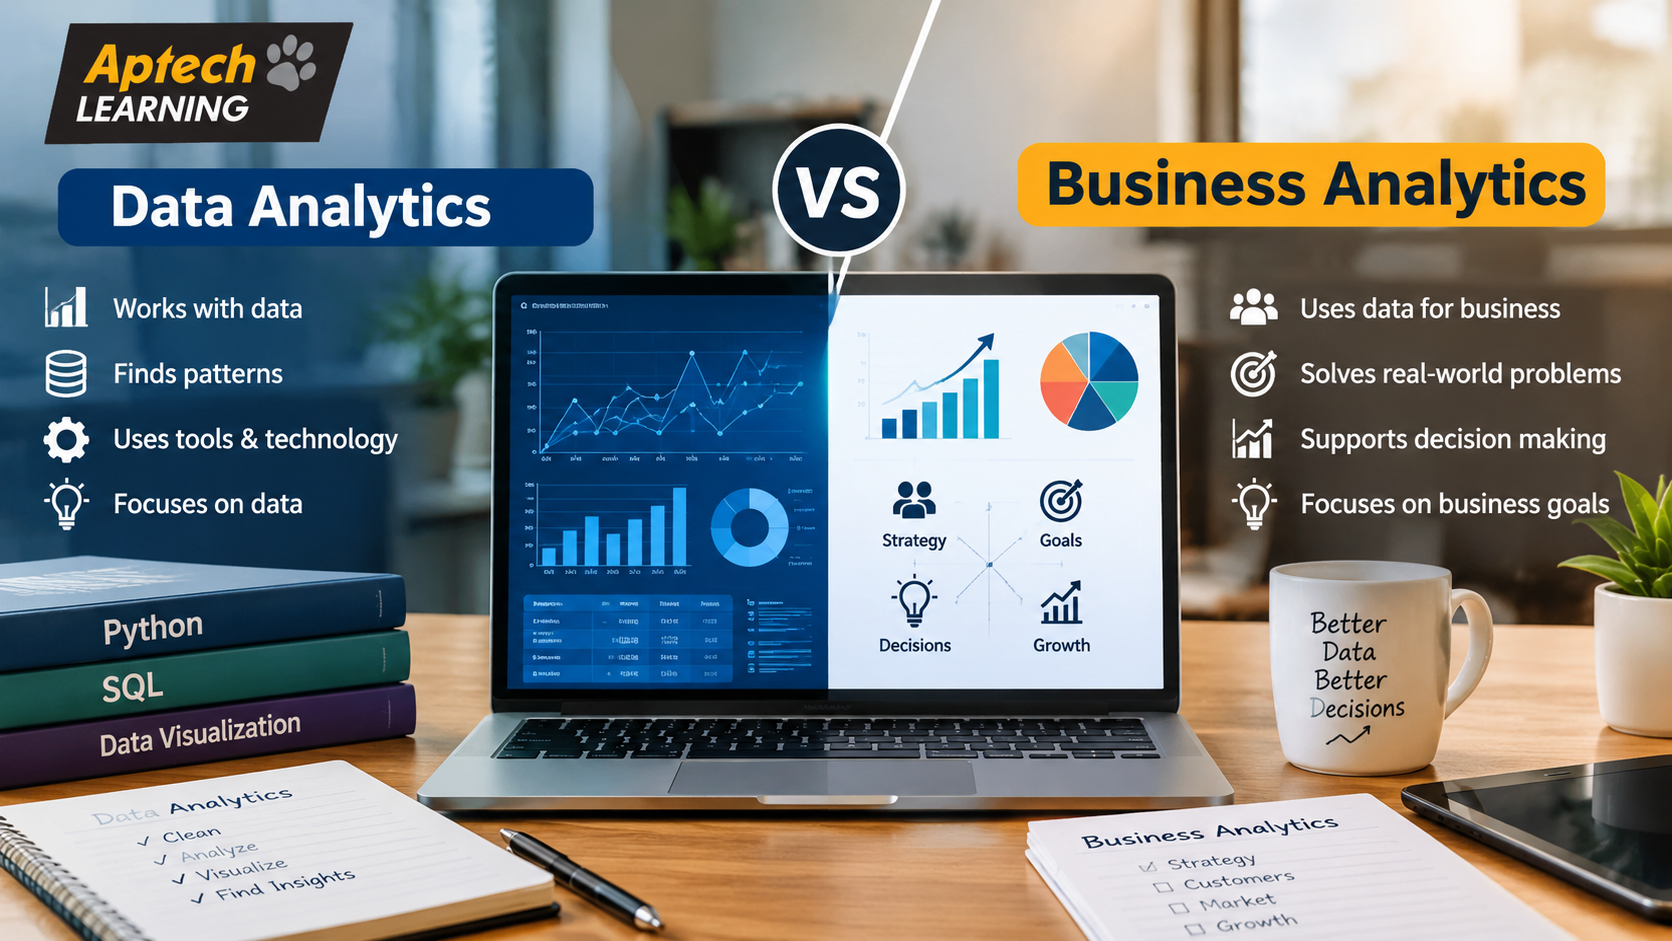
What is Data Analytics Data analytics is the process of collecting, cleaning, and studying data to identify patterns, trends, and answers to specific questions. It is a fairly technical field, relying heavily on tools like Excel, SQL, and data visualisation software to work directly with raw data and extract meaningful insights from it. Think of a data analyst as someone working closely with the raw material itself, cleaning messy spreadsheets, writing queries to pull specific information from databases, and building charts that clearly show what the numbers actually reveal. The focus here is primarily on the technical process of working with data accurately and efficiently, answering questions like “what happened” and “why did it happen” through direct data work. What is Business Analytics Business analytics is a broader field that combines data analysis with business strategy, decision-making frameworks, and organisational understanding. While it still involves working with data, its primary focus is on using those insights to guide business decisions, identify opportunities, and solve strategic problems, rather than purely on the technical process of data handling itself. Think of a business analyst as someone standing a bit further back from the raw data, using insights, sometimes produced by a data analyst, to answer bigger-picture questions like “what should the business do next” or “how should we approach this market opportunity.” The focus shifts from the technical mechanics of data work toward applying those insights within a broader business and strategic context. Why This Distinction Genuinely Matters Understanding the real difference between these two fields matters for a few practical reasons: It helps you choose the right course or learning path, since data analytics courses often go deeper into technical tools, while business analytics programs typically include more business strategy and decision-making content. It clarifies job descriptions, since companies sometimes use these titles inconsistently, and understanding the core distinction helps you evaluate what a specific role actually involves. It helps you play to your natural strengths, since some people are drawn more to technical, detail-oriented data work, while others are more interested in strategic, big-picture business thinking. It supports better long-term career planning, since these two paths can lead to somewhat different specialisations and growth trajectories over time. It prevents miscommunication in professional settings, where using these terms accurately reflects genuine understanding of your own role and skill set. Key Differences Between Data Analytics and Business Analytics Aspect | Data Analytics | Business AnalyticsPrimary Focus | Technical data collection, cleaning, and analysis | Applying insights to business strategy and decisionsCore Tools | Excel, SQL, Power BI, sometimes Python | Business intelligence tools, forecasting models, strategic frameworksTypical Questions Answered | What happened, why did it happen | What should we do next, how do we solve this business problemSkill Emphasis | Technical, detail-oriented data handling | Strategic thinking combined with data interpretationCommon Job Titles | Data Analyst, Reporting Analyst | Business Analyst, Business Intelligence AnalystEducational Background Fit | Works well for detail-oriented, technically curious learners | Works well for strategically minded, business-focused learners How the Two Fields Work Together (Step-by-Step) Data Analyst vs Business Analyst as Job Roles Looking at these as actual job roles helps clarify the distinction further. A data analyst typically spends most of their time directly working with data, writing SQL queries, cleaning datasets, building dashboards, and identifying patterns, focusing primarily on the technical accuracy and clarity of the analysis itself. A business analyst typically spends more time understanding business processes, gathering requirements from stakeholders, and translating data insights or business needs into clear recommendations or specifications for change. There is often meaningful overlap between these roles in smaller companies, where one person may handle both responsibilities, while larger organisations tend to separate them into more distinct, specialised positions. Practical Examples Retail Sales Analysis: A data analyst studies raw sales data to identify which products are underperforming in specific regions, while a business analyst uses these findings to recommend a specific regional marketing or pricing strategy adjustment. New Product Launch: A data analyst analyses customer survey and market data, while a business analyst combines this with competitive market understanding to recommend whether and how the company should proceed with the new product launch. Process Improvement Project: A data analyst identifies bottlenecks in a company’s operational data, while a business analyst works with different departments to design and recommend a specific process change based on those findings. Customer Churn Reduction: A data analyst builds a report identifying patterns in customer churn data, while a business analyst uses this information to propose specific retention strategies aligned with overall business goals. Common Mistakes People Make When Choosing Assuming the two fields are essentially identical. While overlapping, they genuinely emphasise different skill sets, technical data work versus strategic business application. Choosing based only on job title popularity without understanding actual role content. Some learners pick a path based on which title sounds more appealing, without checking what the actual day-to-day work involves. Not considering personal strengths and interests. Choosing a highly technical data analytics path despite genuinely preferring big-picture strategic thinking, or vice versa, can lead to less career satisfaction. Assuming one path is definitively “better” than the other. Both fields offer strong, legitimate career opportunities; the better choice depends entirely on individual interest and strengths, not inherent superiority. Ignoring the overlap between the two fields. Some learners treat these as completely separate, unrelated fields, missing how frequently they work together in real business environments. Not researching specific course content before enrolling. Course names can be inconsistent, so it is important to check actual syllabus content rather than assuming based on the course title alone. Career Opportunities Compared Career paths differ somewhat between the two fields, though meaningful overlap exists. Data Analytics Career Opportunities Data Analyst — collects, cleans, and analyses data to answer specific business questions Reporting Analyst — focuses specifically on building and maintaining regular data reports Data Visualisation Specialist — focuses on building clear, effective dashboards and visual reports Junior Data Scientist Pathway — data analytics often serves

Explore More


Data Analytics Course Eligibility: Who Can Join

Data Analytics Course Eligibility: Who Can Join

Why Eligibility Confusion Is So Common A lot of the confusion around data analytics eligibility comes from mixing it up with more rigid technical fields like data science or software engineering, which sometimes do lean more heavily on strong mathematics or programming backgrounds. Data analytics, while related, is generally more accessible, and its eligibility criteria reflect that. Think of it like the difference between learning to drive a car and becoming an automotive engineer. Both are related to vehicles, but one requires a genuinely deep technical background, while the other is accessible to most people willing to learn the practical skills involved, regardless of their educational history. Data analytics leans much closer to the driving example, practical, learnable skills that do not require a specific prior degree. Once this distinction is clear, most of the eligibility confusion naturally clears up too. Why Understanding Real Eligibility Requirements Matters Understanding actual eligibility requirements, rather than assumptions, matters for a few clear reasons: It prevents people from unnecessarily ruling themselves out of a genuinely accessible and valuable career path due to incorrect assumptions about needing a technical degree. It helps you set realistic expectations about how much foundational learning you will need if you are coming from a completely non-technical background. It helps you choose the right starting course level, since some programs cater specifically to complete beginners, while others assume some existing familiarity. It supports better decision-making for career changers, since knowing you are genuinely eligible can be the deciding factor in finally pursuing a career shift. It reduces unnecessary hesitation, allowing you to start learning sooner rather than delaying due to unfounded eligibility concerns. Types of Learners Who Typically Join Data Analytics Courses Data analytics courses attract a genuinely diverse mix of learners, not just computer science graduates. Commerce and Finance Background StudentsThese learners often bring strong numerical comfort and business understanding, which translates well into analytics work. Science and Engineering GraduatesThese learners often have a head start in logical thinking and sometimes basic programming exposure, though this is not a strict requirement. Arts and Humanities GraduatesThese learners may need slightly more foundational support initially but are just as capable of succeeding with consistent effort and practice. Working Professionals from Non-Technical RolesThese learners often bring valuable business context and practical experience, which strengthens their ability to apply analytics to real-world problems. Complete Beginners with No Formal Degree FocusThese learners, sometimes including 12th-grade students, benefit from foundational courses designed specifically to build skills from the ground up. Learner Type | Typical Strength | Common Starting PointCommerce/Finance Background | Numerical comfort, business context | Often start slightly ahead in data logicScience/Engineering Background | Logical thinking, some technical exposure | May pick up tools faster initiallyArts/Humanities Background | Strong communication, adaptable learning | May need more foundational practice timeWorking Professionals | Practical business experience | Often value-driven, goal-focused learning Step-by-Step Guide to Checking If You’re Eligible Educational Background vs Practical Skill Requirements Understanding this distinction clears up much of the eligibility confusion. Educational background requirements for data analytics courses are generally quite minimal, typically just higher secondary education or a graduate degree, regardless of the specific subject studied. Practical skill requirements, on the other hand, are what you will actually build during the course itself, tools like Excel, SQL, and basic statistics are taught progressively, not assumed as prerequisites. In simple words: your educational background largely just needs to meet a basic minimum, while the actual practical skills needed for data analytics are things the course itself is specifically designed to teach you, regardless of your starting point. Practical Examples Commerce Graduate with No Coding Background: A commerce graduate with strong Excel familiarity but no prior coding experience joins a beginner-friendly data analytics course, successfully building SQL and Power BI skills progressively. Arts Graduate Switching Careers: An arts graduate interested in a career change joins a foundational data analytics program, starting from basic Excel and gradually building toward more advanced tools over a few months. 12th-Grade Student Exploring Early Career Options: A student who has just completed 12th grade, unsure about pursuing a traditional computer science degree, joins a foundational data analytics course to explore the field practically. Working Professional in Marketing: A marketing professional with strong business understanding but limited technical background joins a data analytics course specifically to strengthen their ability to interpret campaign performance data. Common Misconceptions About Eligibility Believing you need a computer science degree to join. This is one of the most common and inaccurate assumptions, since most beginner courses are specifically designed for non-technical backgrounds. Assuming strong mathematics skills are mandatory. While basic numerical comfort helps, advanced mathematics is generally not a strict requirement for foundational data analytics courses. Thinking prior coding experience is necessary. Most beginner-level data analytics courses teach SQL and other tools from the basics, without assuming any prior programming knowledge. Believing age or career stage limits eligibility. Data analytics courses are generally open to students, fresh graduates, and experienced working professionals alike. Assuming a specific academic stream, like science, is required. Commerce and arts graduates regularly succeed in data analytics, often bringing valuable business or communication strengths to the field. Not checking the specific course’s actual stated eligibility. Relying on general assumptions rather than directly confirming a specific course’s requirements can lead to unnecessary hesitation or confusion. What You Should Have Before Starting While formal eligibility requirements are minimal, a few practical readiness factors genuinely help before starting a data analytics course: Basic comfort using a computer, including typing and navigating standard software General numerical comfort, even without advanced mathematics knowledge A genuine willingness to learn new, unfamiliar tools and concepts step by step Enough available time to commit to consistent, regular practice throughout the course Realistic expectations that foundational learning takes time, especially without prior technical exposure Curiosity about how data can answer real, practical business questions Career Opportunities Regardless of Background Data analytics career opportunities are genuinely accessible across different educational backgrounds, since employers largely value demonstrated, practical skill over the

Explore More
Data Analytics Course Fees in India: What to Expect

Data Analytics Course Fees in India: What to Expect

Why Data Analytics Course Fees Vary So Much If you have already searched around, you have probably noticed that data analytics course fees can range from a few thousand rupees to well over a lakh, depending on where you look. This wide range often confuses beginners, who reasonably wonder whether the more expensive courses are actually better, or whether they are just priced higher without real justification. Think of it like buying a laptop. A basic laptop and a high-end one can both technically let you browse the internet, but the difference lies in build quality, features, and long-term reliability. Similarly, a lower-fee data analytics course might teach you basic Excel skills, while a higher-fee course might include SQL, Power BI, Python, live projects, and placement support. The fee difference often reflects real differences in depth, format, and support, not just arbitrary pricing. Why Understanding Fee Structure Matters Understanding what drives data analytics course fees matters for a few clear reasons: It helps you avoid overpaying for a course that does not actually match your learning goals or current skill level. It helps you avoid underpaying for a course that looks affordable but lacks the depth needed to actually build job-ready skills. It allows you to compare courses meaningfully, rather than just comparing raw price tags without context. It helps you plan your budget more realistically, especially if you are also factoring in additional costs like certification or exam fees. It supports better decision-making overall, since you will understand exactly what you are paying for, rather than assuming all courses are essentially the same. Types of Data Analytics Courses by Fee Range Data analytics courses in India generally fall into a few broad fee categories, each offering a different depth of learning. Basic, Short-Term CoursesThese typically cover foundational tools like Excel and basic SQL, often over a shorter duration, at a relatively lower fee point. Comprehensive, Mid-Range CoursesThese typically cover Excel, SQL, and a visualisation tool like Power BI or Tableau, often including some hands-on project work, at a moderate fee point. Advanced, Full Program CoursesThese typically cover the full data analytics toolkit, including Python, advanced statistics, and multiple real-world projects, often at a higher fee point, sometimes with placement support. Specialised Certification ProgramsThese often focus on a specific globally recognised certification, with fees influenced significantly by the certification body itself, in addition to the training. Course Type | Typical Coverage | General Fee PositioningBasic, Short-Term | Excel, basic SQL | Lower fee rangeComprehensive, Mid-Range | Excel, SQL, Power BI/Tableau | Moderate fee rangeAdvanced, Full Program | Excel, SQL, Python, projects | Higher fee rangeSpecialised Certification | Certification-specific content | Varies based on certifying body Factors That Affect Course Fees (Step-by-Step) Online vs Offline vs Hybrid Course Fees Understanding how format affects fees helps set realistic expectations. Online courses, especially self-paced ones, often have lower fees due to reduced infrastructure and operational costs, though live, interactive online courses can be priced similarly to offline ones. Offline courses typically involve classroom infrastructure, in-person trainer time, and often smaller batch sizes, which can be reflected in a somewhat higher fee structure. Hybrid courses combine both formats, and their fees generally fall somewhere between fully online and fully offline options, depending on how much in-person time is included. In simple words: format alone does not determine quality, but it does influence cost, and it is worth considering which format genuinely supports how you learn best before comparing fees. Practical Examples Student on a Tight Budget: A college student compares a few basic, short-term Excel-focused courses, choosing an affordable option to build foundational skills before investing further. Working Professional Seeking Depth: A working professional invests in a comprehensive, mid-range course that includes SQL and Power BI, prioritising depth over the lowest possible price. Career Changer Wanting Full Support: A career changer opts for a higher-fee, advanced program that includes Python, live projects, and placement support, viewing it as a longer-term career investment. Learner Comparing Multiple Options: A learner requests a detailed breakdown of what is included in three different courses before deciding, rather than comparing only the final fee amount. Common Mistakes People Make While Comparing Fees Choosing the cheapest option without checking curriculum depth. A very low fee sometimes means limited tool coverage or minimal practical project work. Assuming higher fees always mean better quality. Some expensive courses are priced based on brand reputation alone, without necessarily offering proportionally more value. Not asking what exactly is included in the fee. Some courses charge extra for certification, projects, or additional support that is not clearly mentioned upfront. Ignoring format fit. Choosing a course purely based on price without considering whether the format, online, offline, or hybrid, actually suits your learning style. Not comparing multiple options. Enrolling in the first course found without comparing at least two or three alternatives can lead to missing better-value options. Overlooking hidden costs. Some courses have additional costs for certification exams, software access, or extended support that are not part of the base fee. What a Fair-Priced Course Should Include A genuinely fair-priced data analytics course should generally offer: A clear, structured curriculum covering relevant tools based on the fee level, whether that is Excel alone or a more advanced toolkit Some level of hands-on, practical project work, not just theoretical lessons Transparent information about what is and is not included in the base fee Reasonable access to trainer support or doubt-clearing sessions A realistic sense of how the course will help you build a usable, demonstrable skill set Clarity on any additional costs, such as certification exams or extended access fees How to Judge Value Beyond Just Price Rather than asking “is this course expensive or cheap,” it is more useful to ask “does this course’s fee match what it actually delivers.” A course that costs more but includes SQL, Power BI, real projects, and mentoring support may offer significantly more value than a cheaper course covering only basic Excel. Similarly, a very expensive course is not

Explore More
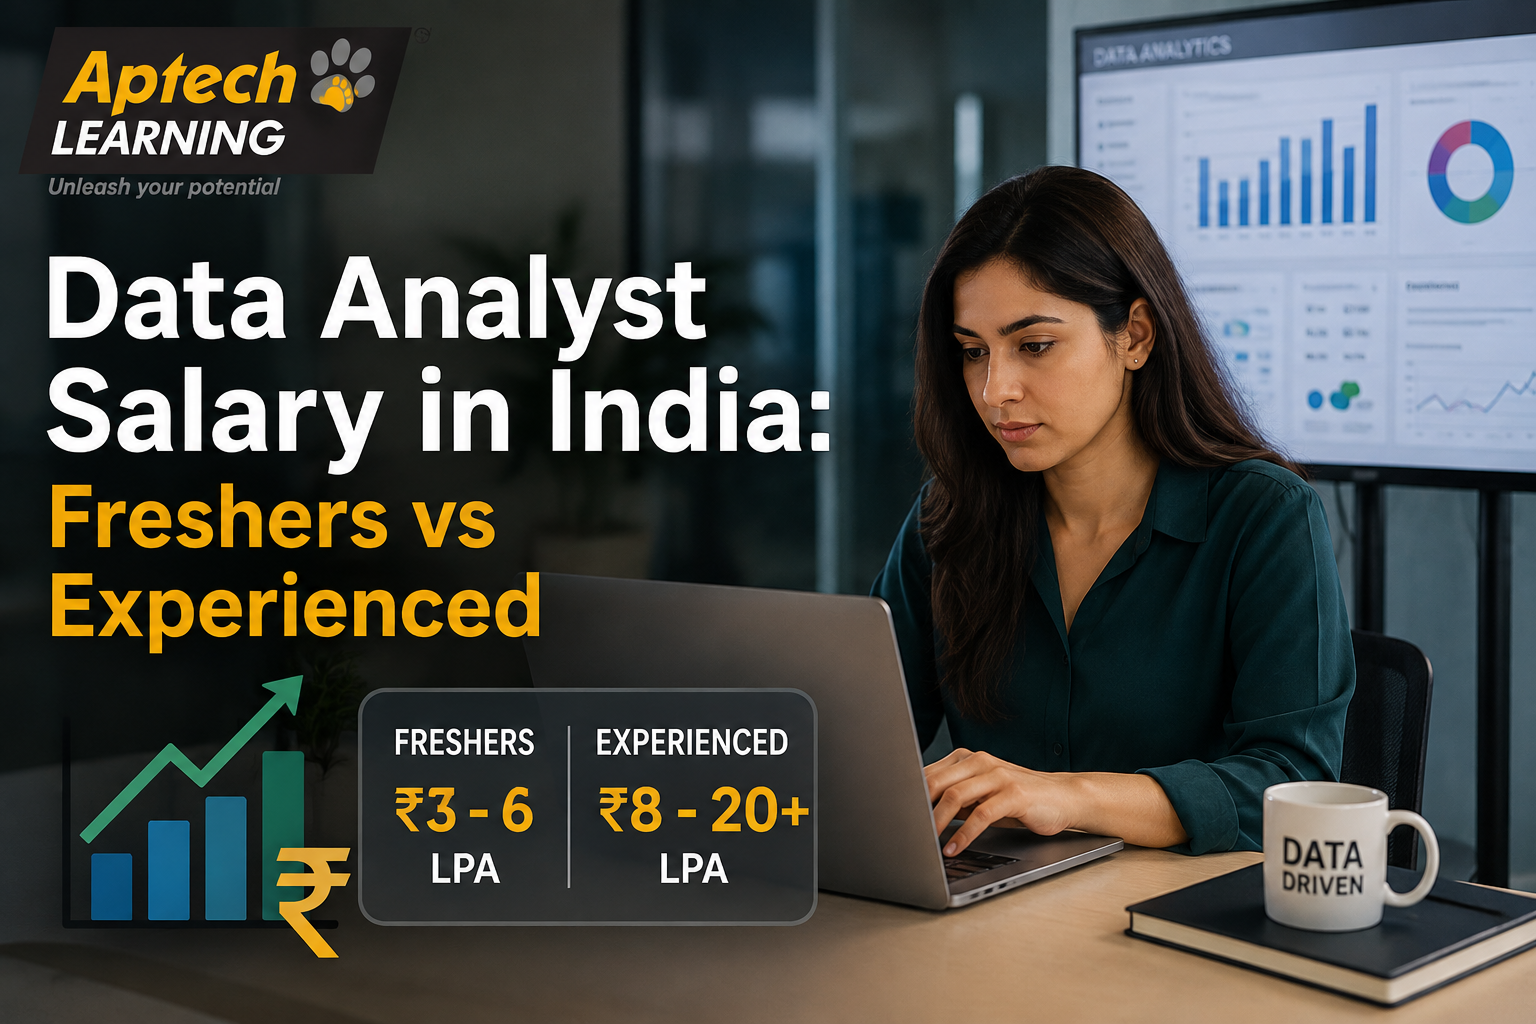
Data Analyst Salary in India: Freshers vs Experienced

Data Analyst Salary in India: Freshers vs Experienced

Data Analyst Salary Overview: Freshers vs Experienced Data analyst salaries in India are rarely a single fixed number, and the difference between a fresher and an experienced professional often reflects far more than just years on a resume. It reflects the depth of practical skill, the complexity of problems someone can solve independently, and how much business impact their analysis has actually delivered. A fresher typically starts by learning to apply tools like Excel, SQL, and Power BI on relatively guided or smaller-scale tasks. An experienced data analyst, on the other hand, often works independently on complex, ambiguous business problems, mentors junior team members, and directly influences strategic decisions. This difference in responsibility and independence is a major reason the pay gap widens over time, not just the number of years worked. Why the Salary Gap Exists The salary gap between freshers and experienced data analysts exists for a few clear, practical reasons: Freshers are still building core technical fluency, while experienced analysts have already developed speed, accuracy, and confidence across multiple tools. Experienced analysts can handle ambiguous, complex business problems independently, while freshers often need more guidance and structured tasks. Experienced professionals often carry a track record of measurable business impact, which employers are willing to pay more for compared to unproven potential. Senior analysts frequently take on additional responsibilities like mentoring, stakeholder communication, or leading small projects, which adds value beyond pure technical work. Employers view experienced hires as lower-risk, since their past work demonstrates real-world reliability that a fresher’s resume cannot yet show. What Freshers Typically Earn Freshers entering data analytics roles typically start at the lower end of the pay scale, reflecting their limited hands-on, real-world project experience. This is a completely normal starting point in almost every technical field, not something specific to data analytics. At this stage, pay is generally influenced more by the strength of a candidate’s portfolio, internship experience, and demonstrated tool proficiency than by formal education alone. Freshers who arrive with strong, well-documented personal projects, especially those built using real or realistic datasets, often have a slight edge over those with only theoretical coursework, even at the same experience level. What Experienced Data Analysts Typically Earn Experienced data analysts, generally those with three or more years of hands-on work, tend to earn noticeably more than freshers, reflecting their proven ability to independently manage complex analysis and deliver reliable business insights. At this stage, pay is influenced heavily by specialisation, such as expertise in advanced SQL, deeper statistical analysis, or strong dashboard and storytelling skills using tools like Power BI or Tableau. Analysts who have consistently delivered measurable business value, such as improving a process or identifying a significant cost-saving insight, are often able to command higher pay compared to those with similar years of experience but a less demonstrable impact. Salary Growth Timeline (Step-by-Step) Freshers vs Experienced: Key Differences Beyond Salary The salary gap is only one part of the picture; freshers and experienced data analysts also differ in a few other important ways. Freshers typically work with more structured, well-defined tasks, while experienced analysts often handle ambiguous problems that require independently deciding how to approach the analysis. Freshers usually rely more on guidance from senior team members, while experienced analysts are often expected to guide and mentor junior colleagues themselves. Freshers tend to focus primarily on technical execution, while experienced analysts increasingly balance technical work with stakeholder communication and business strategy input. In simple words: the salary difference reflects not just time spent in the field, but a real difference in independence, responsibility, and demonstrated business impact. Practical Examples Fresher in an IT Company: A fresher data analyst joins a support team, handling structured weekly reporting tasks under a senior analyst’s guidance, gradually building independence over the first year. Mid-Level Analyst in E-commerce: An analyst with three years of experience independently leads customer segmentation analysis, directly influencing a company’s targeted marketing strategy. Experienced Analyst in Banking: A senior data analyst with six years of experience builds a risk analysis model that helps the bank identify high-risk loan applications more accurately, demonstrating clear, measurable business impact. Analyst Transitioning to Leadership: An experienced analyst with strong technical and communication skills moves into an analytics team lead role, combining hands-on analysis with mentoring junior analysts. Common Mistakes That Slow Salary Growth Staying only within one tool’s comfort zone. Analysts who do not expand beyond basic Excel or one visualisation tool often see slower salary growth compared to those who broaden their skill set. Not documenting business impact. Analysts who cannot clearly explain the real business value of their past work often struggle to justify higher pay during appraisals or interviews. Avoiding ambiguous or complex projects. Sticking only to simple, well-defined tasks limits the opportunity to demonstrate the independent problem-solving skills that support senior-level pay. Neglecting communication skills. Analysts who cannot clearly explain their findings to non-technical stakeholders often struggle to be seen as ready for higher-responsibility roles. Not negotiating based on demonstrated value. Some experienced analysts underprice themselves by not clearly presenting their track record during salary discussions. Staying too generalist for too long. While flexibility has value, not developing at least one area of deeper specialisation can slow salary growth in more senior stages. Career Opportunities at Each Stage Data analyst career opportunities naturally expand as experience grows. Common progression includes: Junior Data Analyst — an entry-level role focused on structured reporting and guided analysis tasks. Data Analyst — a role involving more independent analysis and regular stakeholder interaction. Senior Data Analyst — a role focused on complex, high-impact analysis and mentoring junior team members. Analytics Manager — a leadership role overseeing a team of analysts and broader analytics strategy. Specialised Analyst Roles — roles like marketing analyst or financial analyst that combine data analysis with deep domain expertise. Analytics Consultant — an advanced role advising multiple businesses or teams on data-driven decision-making. As professionals move through these stages, both responsibility and pay tend to grow together, reflecting increasing independence, specialisation,

Explore More
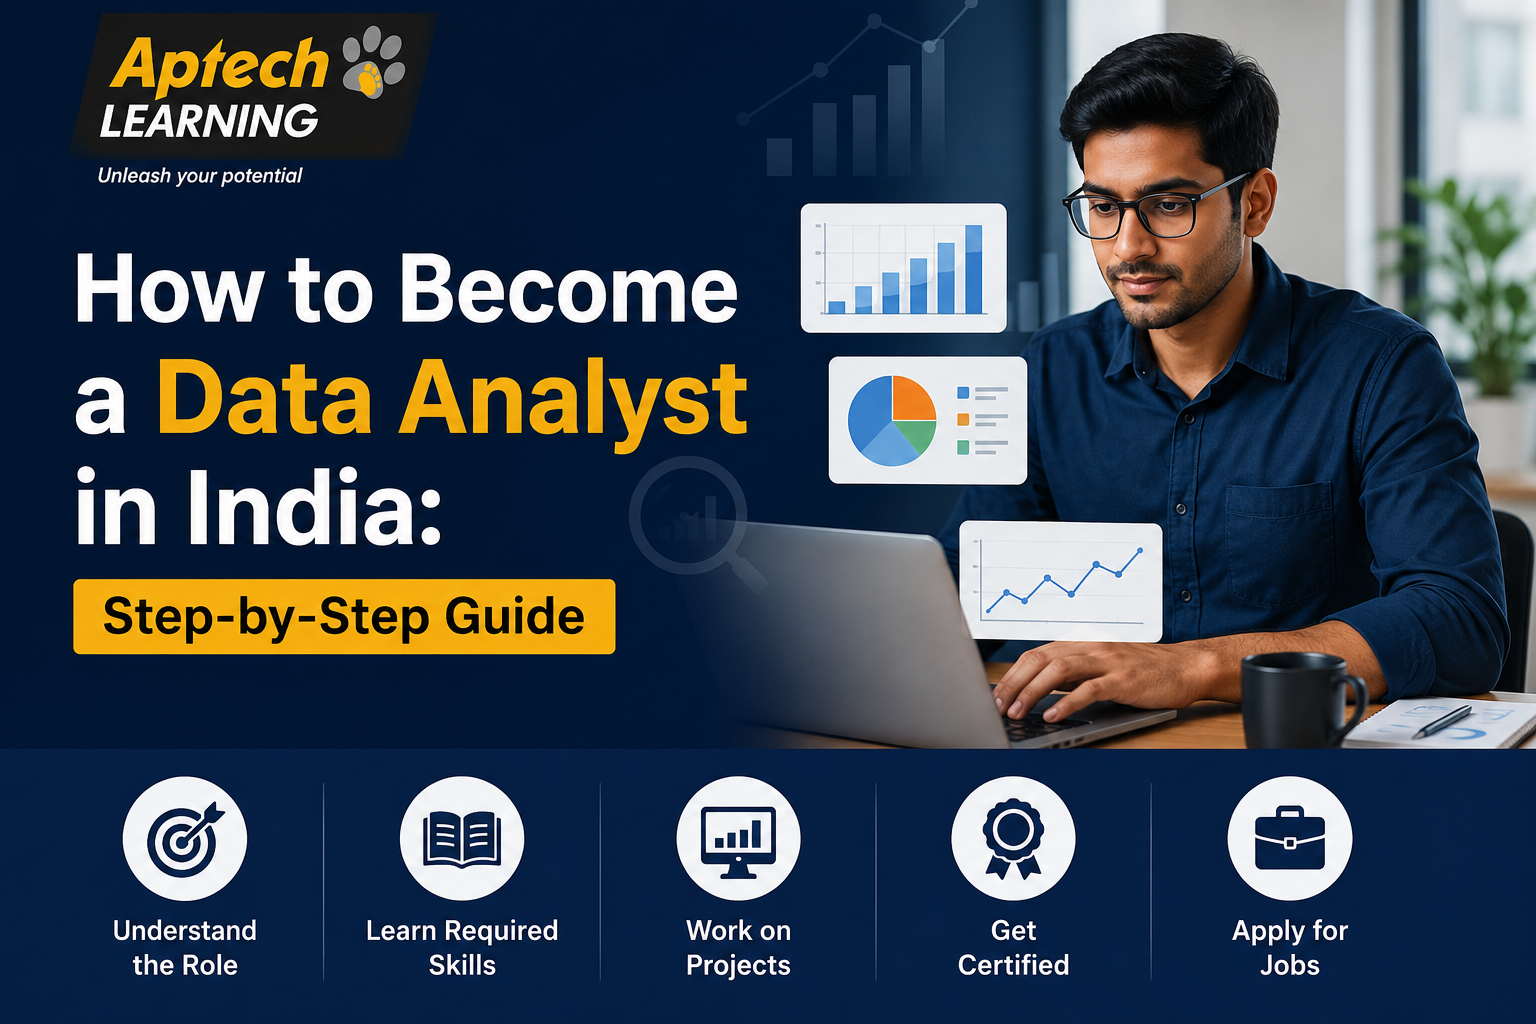
How to Become a Data Analyst in India: Step-by-Step Guide

How to Become a Data Analyst in India: Step-by-Step Guide

A data analyst is someone who collects, cleans, and studies data to help businesses make informed decisions. Instead of guessing why sales dropped or which customers are most valuable, companies rely on data analysts to look at the actual numbers and explain what is really happening. Think of a data analyst like a detective, but instead of solving crimes, they solve business problems using evidence found in data. A retail company might ask, “Why did sales fall in Lucknow last month?” A data analyst would look at sales records, customer behaviour, and other relevant data to find a clear, evidence-based answer, rather than relying on assumptions. In India, data analysts work across almost every industry, including IT, banking, e-commerce, healthcare, and manufacturing, since nearly every business today collects some form of data worth analysing. Why Data Analytics is a Strong Career Choice in India Data analytics continues to be a strong career choice in India for a few clear reasons: Indian businesses across sectors are increasingly relying on data to guide decisions, creating consistent demand for people who can interpret that data. The learning path is fairly practical and project-based, allowing learners to build a visible portfolio of real analysis work fairly early. It does not strictly require a technical or engineering degree, making it accessible to commerce, science, and even arts graduates with strong logical thinking. It offers a clear pathway into more advanced data roles, such as data science, for those who want to grow further in this direction. Remote and hybrid opportunities have grown in this field, giving Indian data analysts access to both domestic and international job opportunities. Types of Data Analyst Roles Data analyst roles can vary slightly depending on the industry and specific focus area. Business Data AnalystThis role focuses on analysing business performance data to support decisions related to sales, operations, or strategy. Marketing Data AnalystThis role focuses on studying customer behaviour, campaign performance, and marketing data to guide marketing decisions. Financial Data AnalystThis role focuses on analysing financial data to support budgeting, forecasting, and investment-related decisions. Operations Data AnalystThis role focuses on analysing data related to processes, logistics, or supply chains to improve efficiency. Healthcare Data AnalystThis role focuses on analysing patient, treatment, or hospital operations data to support better healthcare decisions. Role Type | Main Focus | Example TaskBusiness Data Analyst | Overall business performance | Sales trend analysisMarketing Data Analyst | Customer and campaign data | Campaign performance reportingFinancial Data Analyst | Financial data and forecasting | Budget variance analysisOperations Data Analyst | Process and logistics data | Supply chain efficiency reports Step-by-Step Guide to Becoming a Data Analyst Data Analyst vs Data Scientist vs Business Analyst These three roles are related but focus on different responsibilities. A data analyst focuses on analysing existing data to answer specific business questions, typically using tools like SQL, Excel, and visualisation software. A data scientist goes further, building predictive models using machine learning and advanced statistics, often requiring stronger programming skills. A business analyst focuses more on understanding business processes and requirements, using data as one input among several to guide strategy and decision-making. In simple words: a data analyst studies existing data to answer questions, a data scientist builds systems that predict future outcomes, and a business analyst focuses more broadly on business needs, using data as supporting evidence. Practical Examples E-commerce Company: A data analyst studies customer purchase data to identify which product categories perform best during festive seasons, helping the business plan inventory and marketing in advance. Banking Sector: A data analyst reviews transaction data to identify patterns linked to loan defaults, helping the bank refine its risk assessment process. Healthcare Organisation: A data analyst studies patient appointment data to identify peak hours, helping the hospital adjust staffing schedules more efficiently. Retail Business: A data analyst compares sales performance across different store locations in Lucknow and nearby cities, helping management understand regional demand differences. Common Mistakes Beginners Make Learning tools without understanding core concepts. Beginners sometimes learn Power BI or SQL commands without understanding the underlying logic of data analysis itself. Skipping the data cleaning step. Jumping straight to analysis without properly cleaning data often leads to inaccurate or misleading conclusions. Focusing only on technical skills. Communication skills matter significantly in this field, and beginners sometimes underestimate how much explaining insights clearly is part of the job. Not building a portfolio early. Waiting too long to start real projects delays building the practical proof of skill that employers actually look for. Trying to learn too many tools at once. Beginners often try to learn Excel, SQL, Python, and multiple visualisation tools simultaneously, which slows down genuine mastery of any one of them. Ignoring business context. Beginners sometimes focus purely on numbers without considering the actual business problem the analysis is meant to solve. Career Opportunities Data analytics offers a wide range of career paths across almost every industry in India. Common roles include: Data Analyst — collects, cleans, and analyses data to support business decisions. Business Intelligence Analyst — builds dashboards and reports that support ongoing business monitoring. Marketing Analyst — studies customer behaviour and campaign performance data. Financial Analyst — analyses financial data to guide budgeting and forecasting decisions. Operations Analyst — studies process and logistics data to improve efficiency. Data Visualisation Specialist — focuses specifically on building clear, effective dashboards and reports. As experience grows, professionals can move into senior analyst roles, specialised analytics positions, or transition further into data science. Salary Information Salary for data analysts in India depends on factors such as your city, the size and industry of the company, your specific role, your skill level, and your years of experience. Entry-level roles naturally pay less than senior analyst positions, and metro cities generally offer higher packages than smaller towns. Rather than fixed numbers, it is more useful to know that salaries tend to grow steadily as you gain hands-on project experience and strengthen skills in SQL, visualisation tools, and, increasingly, basic Python. Skills

Explore More
What is Data Analytics? A Complete Beginner's Guide

What is Data Analytics? A Complete Beginner’s Guide

Data analytics is the process of collecting, cleaning, and studying data to find useful patterns and answers that help people make better decisions. It combines statistics, technology, and business thinking. Companies use data analytics to understand customers, improve products, cut costs, and predict future trends based on past information. What is Data Analytics Data analytics means taking raw, messy data and turning it into information that actually makes sense. Think of it like a doctor looking at your blood test report. The lab gives numbers — sugar level, cholesterol, blood count. On their own, these numbers mean nothing to most of us. But a doctor studies these numbers and tells you something useful: whether you are healthy, what to eat, whether you need medicine. A data analyst does the same thing for businesses. They take numbers — sales figures, website visits, customer complaints — and turn them into decisions. Should the company launch a new product? Which city has the most demand? Why did sales drop last month? Data analytics answers these questions using facts, not guesswork. Why Data Analytics Matters Every industry today runs on data. A retail store tracks which products sell fastest. A hospital tracks patient recovery rates. A bank tracks which customers are likely to miss a loan payment. Without data analytics, businesses would be making decisions based on assumptions and guesswork, which often leads to losses. Here is why it matters so much right now: Businesses generate more data than ever before, from mobile apps, websites, sensors, and social media. Competition has increased, so companies need every advantage, including smarter decisions based on real numbers. Customers expect personalised experiences, and this is only possible when businesses understand their behaviour through data. Automation and AI tools depend heavily on clean, well-analysed data to function correctly. Types of Data Analytics There are four main types of data analytics, and each one answers a different kind of question. Descriptive Analytics This type answers “What happened?” It looks at past data and summarises it. For example, a report showing last month’s total sales by region is descriptive analytics. Diagnostic Analytics This type answers “Why did it happen?” It digs deeper into the data to find the cause of a result. For example, finding out why sales dropped in a particular city last quarter. Predictive Analytics This type answers “What is likely to happen next?” It uses historical data and statistical models to forecast future outcomes, such as predicting next month’s demand for a product. Prescriptive Analytics This type answers “What should we do about it?” It goes one step further than prediction and suggests specific actions, such as recommending which products to restock before a festive season. Type of Analytics | Question It Answers | ExampleDescriptive | What happened? | Monthly sales reportDiagnostic | Why did it happen? | Reason behind a sales dropPredictive | What will happen? | Forecasting next quarter’s demandPrescriptive | What should we do? | Recommending stock levels How Data Analytics Works (Step-by-Step) Data Analytics vs Data Science vs Data Analysis These three terms are often used interchangeably, but they are not the same. Data analysis is the general act of examining data to draw conclusions. It can be a single task within a bigger project. Data analytics is broader. It includes the tools, techniques, and processes used to analyse data at scale, often across an entire organisation. Data science goes even further. It combines analytics with programming, machine learning, and advanced statistics to build predictive models and AI systems, not just study existing data. In simple words: data analysis is a task, data analytics is a practice, and data science is a full field that includes analytics plus advanced technology. Practical Examples Retail: A clothing brand studies purchase data and notices that jackets sell more in North Indian cities during October and November. They increase stock in those regions before winter starts, avoiding lost sales. Healthcare: A hospital analyses patient readmission data and finds that patients discharged without a follow-up call are more likely to return within 30 days. They introduce a mandatory follow-up call system, reducing readmissions. Banking: A bank analyses transaction patterns and flags unusual activity, such as a sudden large withdrawal from an inactive account, helping catch fraud early. Education: A college studies attendance and exam data and finds that students missing more than 20 percent of classes score significantly lower. This helps them design early intervention programs for at-risk students. Common Mistakes Beginners Make Skipping the data cleaning step. Many beginners jump straight to analysis without cleaning the data, which leads to wrong conclusions. Confusing correlation with causation. Just because two things happen together does not mean one causes the other. Ignoring the business context. Numbers alone do not tell the full story; understanding the industry and situation matters just as much. Overcomplicating visuals. Beginners sometimes add too many colours, charts, and details, making reports harder to understand instead of easier. Not asking a clear question before starting. Analysis without a clear goal often wastes time and produces vague results. Relying only on one tool. Beginners often stick to Excel alone, but real-world roles usually expect familiarity with SQL, Python, or BI tools too. Career Opportunities Data analytics offers a wide range of career paths across almost every industry, including IT, banking, healthcare, retail, and e-commerce. Common roles include: Data Analyst — collects and interprets data to support business decisions. Business Analyst — focuses on translating data insights into business strategy. Data Visualisation Specialist — builds dashboards and reports using tools like Power BI or Tableau. Marketing Analyst — studies customer behaviour and campaign performance. Financial Analyst — uses data to guide investment and budgeting decisions. Operations Analyst — improves efficiency in supply chains and processes using data. As experience grows, professionals can move into senior roles such as Senior Data Analyst, Analytics Manager, or transition into data science. Salary Information Salary in data analytics varies widely depending on factors such as your city, the size and industry of

Explore More
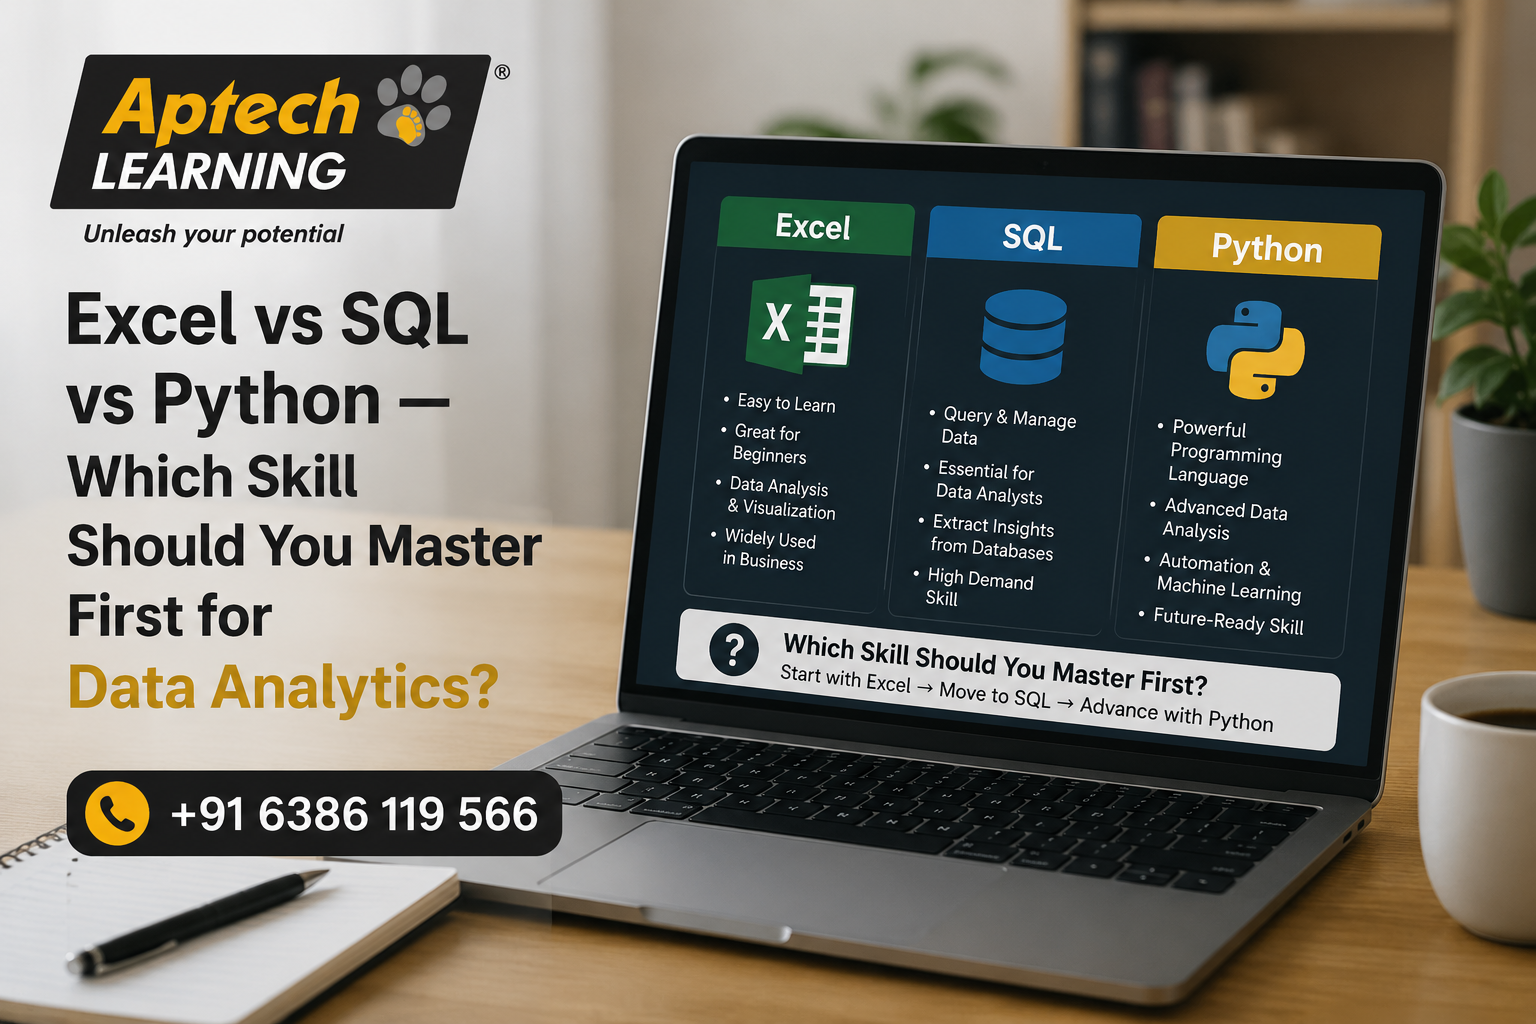
Excel vs SQL vs Python — Which Skill Should You Master First for Data Analytics?

Excel vs SQL vs Python — Which Skill Should You Master First for Data Analytics?

If you’re planning a career in data analytics, one question almost every beginner asks is: should I learn Excel, SQL, or Python first? With so many courses, YouTube videos, and conflicting opinions online, it’s easy to feel stuck before you even begin. The truth is, all three tools are essential for a successful data analytics career, but there’s a smart, logical order to learning them that can genuinely speed up your growth and save you months of confusion. In this blog, we’ll break down which skill to learn first, what each tool is actually used for in real jobs, common mistakes beginners make, and a practical step-by-step roadmap you can follow today. Excel, SQL and Python — Where Each One Fits Tool Main Use Case Difficulty Level Best Suited For Excel Data cleaning, basic analysis, reporting, pivot tables Easy Beginners, small datasets SQL Extracting data from databases, filtering, handling large data Medium Data extraction, real-world databases Python Automation, advanced analysis, machine learning, visualization Medium-High Career growth, advanced analytics Why the Order Actually Matters A lot of beginners try to jump straight into Python because it sounds “advanced” and impressive. But without understanding how data is structured and cleaned (which Excel teaches) or how data is stored and queried (which SQL teaches), Python ends up feeling overwhelming and disconnected from real-world use. Learning in the right sequence means every new tool builds naturally on what you already know, instead of starting from scratch each time. Step 1: Start With Excel Excel is the foundation of data analytics. If you’re a complete beginner, starting with Excel is the easiest and most practical entry point. You should be comfortable with pivot tables, VLOOKUP/XLOOKUP, conditional formatting, charts, and building basic dashboards. Excel also teaches you essential habits like spotting errors, cleaning messy data, and organizing information logically — skills that carry over directly into SQL and Python later on. Most small businesses and even many large companies still rely heavily on Excel for daily reporting, which means this skill alone can open early job opportunities. Step 2: Learn SQL — The Real Source of Data When you start working at actual companies, data usually doesn’t live in Excel sheets — it lives in databases with thousands or millions of rows. SQL (Structured Query Language) helps you pull specific information out of these large datasets, filter it, join multiple tables together, and analyze it efficiently. Almost every data analyst job posting lists SQL as a mandatory skill, often above Python. Learning SQL after Excel also feels natural, since concepts like filtering, sorting, and summarizing data are already familiar to you from spreadsheets. Step 3: Python — Takes Your Career to the Next Level Python becomes essential once you want to move into automation, statistical analysis, predictive modeling, or machine learning. Python libraries like Pandas, NumPy, and Matplotlib make data analysis faster, more powerful, and far more scalable than Excel or SQL alone. If your long-term goal is to grow from data analyst into data scientist or analytics engineer, Python is a must-learn skill. The good news is that by the time you reach Python, you already understand how data behaves (from Excel) and how it’s structured and queried (from SQL) — so Python becomes a tool for deeper analysis rather than a confusing new language. The Right Learning Order Excel → SQL → Python This sequence works best for beginners because each step prepares you for the next. Excel teaches you to understand and clean data, SQL teaches you to extract and manage it at scale, and Python teaches you to analyze, automate, and visualize it at an advanced level. Common Mistakes Beginners Should Avoid Many learners try to study all three tools simultaneously, which often leads to half-finished knowledge in each. Others skip Excel entirely, assuming it’s “too basic,” only to struggle later with fundamental data concepts. A focused, sequential approach — spending real time mastering one tool before moving to the next — almost always produces stronger, job-ready skills. Career Tip If you want to learn all three skills in a structured way without wasting time figuring out what to study next, a proper data analytics course can save you months of confusion. Practical training, real projects, mentorship from industry experts, and placement support can significantly speed up your career growth compared to learning everything alone online. Frequently Asked Questions Conclusion Data analytics isn’t built on a single skill — it’s a combination of tools, and learning them in the right order can make your career path far smoother and far less stressful. Start with Excel to build your foundation, move to SQL to master data extraction, and then learn Python to take your analysis to an advanced, future-ready level. For anyone serious about building a long-term career in this field, following this Excel → SQL → Python roadmap is a smart, practical, and proven approach.

Explore More
Top 10 Companies Hiring Data Analysts in India 2026

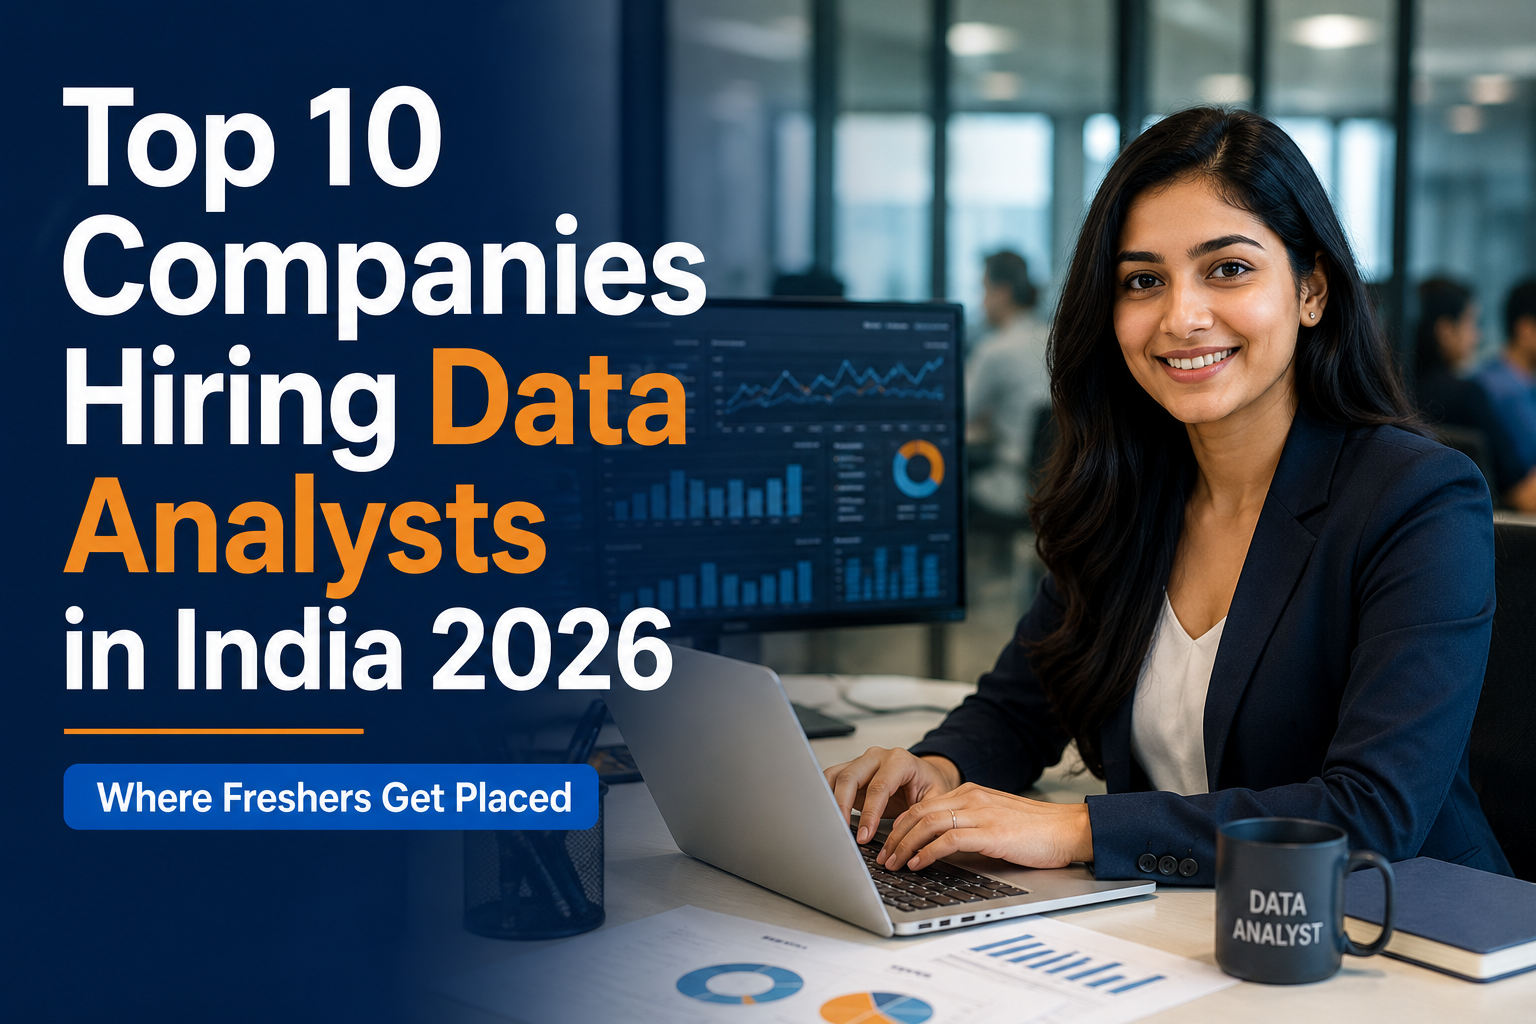
Top 10 Companies Hiring Data Analysts in India 2026 — Where Freshers Get Placed

Knowing how to become a data analyst is only half the journey. The other half — and the part most guides skip — is knowing exactly which companies are actually hiring freshers right now, and what each one expects from you. India’s data analytics market was valued at USD 2.6 billion in 2024 and is projected to reach USD 27 billion by 2033, which means hiring volume is only going up. But not every company on a generic “top 20” list genuinely recruits freshers. Some look impressive on paper but rarely open entry-level seats. This list focuses on companies that consistently hire data analyst freshers in India — with realistic expectations on salary and entry difficulty. Aptechlearninglko Top 10 Companies Hiring Data Analysts in India — 2026 # Company Type Fresher Roles Offered Avg. Starting Salary 1 TCS IT Services Data Analyst, Business Analyst ₹3.5 – ₹5 LPA 2 Infosys IT Services Data Analyst, Reporting Analyst ₹3.5 – ₹5.5 LPA 3 Wipro IT Services Data Analyst (via Early Careers Program) ₹3.5 – ₹5 LPA 4 Accenture IT Services / Consulting Data Analyst, Analytics Associate ₹4 – ₹6 LPA 5 Cognizant IT Services Data Analyst, BI Analyst ₹3.5 – ₹5.5 LPA 6 EXL Analytics / BPM Analyst (Insurance, Healthcare, Finance) ₹4 – ₹6 LPA 7 Genpact Analytics / BPM Data Analyst, Process Analyst ₹3.5 – ₹5.5 LPA 8 Mu Sigma Pure Analytics Firm Decision Scientist Trainee ₹5 – ₹7 LPA 9 Fractal Analytics Pure Analytics Firm Junior Analyst, Data Analyst ₹5 – ₹7.5 LPA 10 Capgemini IT Services Data Analyst, MIS Executive ₹3.5 – ₹5 LPA Most freshers from Tier 2 or Tier 3 colleges typically enter through companies like Tata Consultancy Services, Infosys, or analytics firms rather than direct product-company roles — and this is exactly the realistic entry point for most students from Lucknow and other UP cities. Aptech India IT Giants vs Pure Analytics Firms — Which Should You Target First? Both categories hire freshers, but the experience is very different. Here is an honest comparison: Factor IT Giants (TCS, Wipro, Infosys) Pure Analytics Firms (Mu Sigma, Fractal, EXL) Hiring Volume Very high — mass recruitment Lower — more selective Entry Difficulty Moderate Higher — structured interviews Starting Salary ₹3.5 – ₹5.5 LPA ₹5 – ₹7.5 LPA Day 1 Data Role Guarantee Not guaranteed — depends on project Guaranteed — hired specifically for analytics Learning Curve Slower, broader IT exposure Faster, deep analytics exposure Best For Stability, brand name on resume Skill-building, faster analytics career growth At companies like Wipro, placement into a data role is not guaranteed from day one — the practical path is to join the early careers program, get placed in a project, and actively work toward a data-related team transfer. Pure analytics firms, by contrast, hire you specifically for analytics work from the start. Aptechlearninglko What These Companies Actually Test in Fresher Interviews Knowing the company name means nothing without knowing what they screen for. Here is what shows up consistently across these top 10: Skill Tested How Often It Appears Companies That Emphasize It SQL (joins, subqueries, aggregation) Almost every interview All 10 companies Excel (pivot tables, VLOOKUP) Very common TCS, Wipro, Capgemini, Genpact Power BI / Tableau dashboards Common Accenture, EXL, Fractal Basic Python (Pandas) Increasingly common Fractal, Mu Sigma, EXL Case study / business reasoning Standard at analytics firms Mu Sigma, Fractal, EXL Communication & presentation Universal All 10 companies If your training does not cover SQL deeply, you will struggle regardless of which company you target. It is the single most consistently tested skill across this entire list. How Freshers From Lucknow Actually Reach These Companies Most students assume these companies only hire from metro cities or top-tier colleges. That is no longer fully true. Path How It Works Realistic For Lucknow Students? Campus Placement Through college tie-ups Only if your college has direct partnerships Off-Campus Drives Apply directly via careers page Yes — open to all, more competition Institute Placement Cell Through training institute recruiter network Yes — most accessible route for skill-based hiring Remote/Hybrid Roles Apply to product companies hiring pan-India Yes — growing option post-2024 A structured training program with an active placement cell remains the most realistic and fastest route for freshers in Tier 2 cities to reach recruiter shortlists at these companies. How Aptech Learning Lucknow Helps You Reach These Companies Feature Details Tools Taught Excel, SQL, Python, Power BI, Tableau Live Projects Compulsory, on real business datasets Placement Support Resume + Mock Interviews + Recruiter Referrals Eligibility Class 12 pass or above, any stream Duration 3 to 6 months Contact +91 6386 119 566 Students trained on the exact tools these top companies test for — SQL, Power BI, and Excel — consistently perform better in fresher interviews than candidates with only theoretical course knowledge. Frequently Asked Questions (FAQs) Start Building the Skills These Companies Actually Test For Knowing the company list is step one. Building the SQL, Excel, and Power BI skills they screen for is what actually gets you the offer. 📞 Call / WhatsApp: +91 6386 119 566📧 Email: digilearninglko@gmail.com🌐 Website: aptechlearninglko.com📍 Address: First Floor, Above Radiance, 18 J Road, Near Midland Healthcare, Mahanagar, Lucknow

Explore More
Data Analytics Course Eligibility Criteria 2026

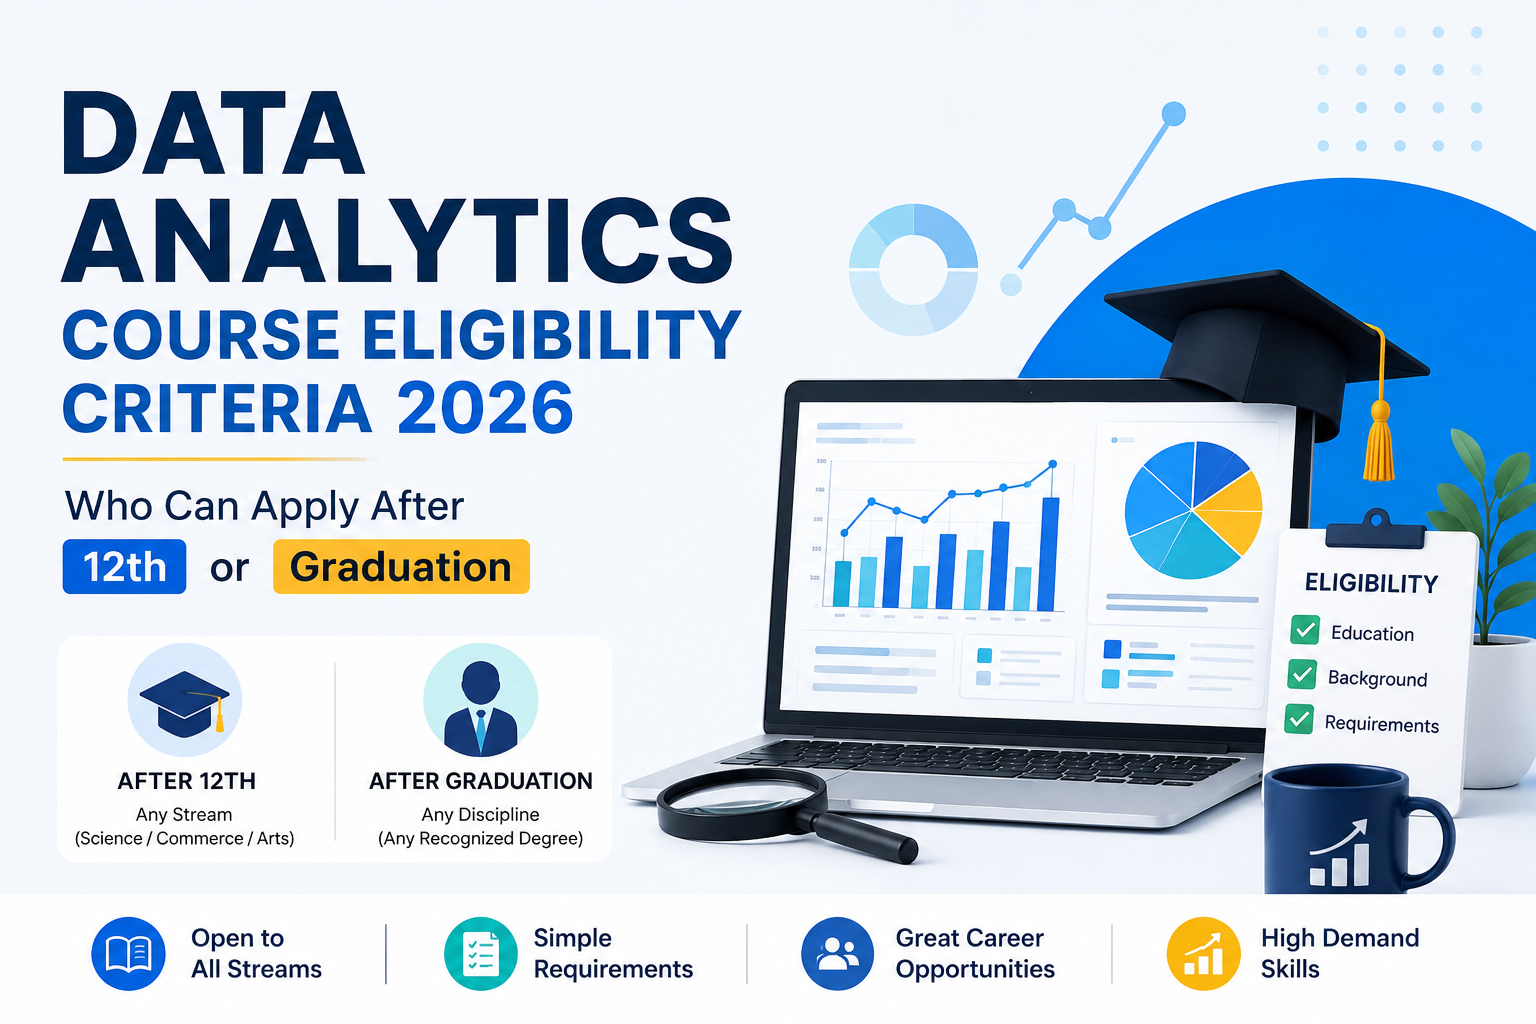
Data Analytics Course Eligibility Criteria 2026 — Who Can Apply After 12th or Graduation

A lot of students hesitate before enrolling in a data analytics course because of one simple doubt — “Am I even eligible?” They assume it is only for engineering students or people who were good at maths in school. That assumption stops thousands of capable students from starting a career that genuinely does not require any of that. The real eligibility for a data analytics certification course is far more relaxed than most people expect — and far more relaxed than what is required for a full data science degree. This guide clears up exactly who can apply, what background you need, and what the actual entry requirements look like in 2026. Data Analytics Course vs Data Science Degree — Eligibility Is Different This is the confusion most students run into first. A data analytics certification and a data science degree are not the same thing, and their eligibility rules are very different. Factor Data Analytics Certification Course Data Science Degree (BSc/BTech) Minimum Qualification Class 12 pass, any stream Class 12 with Maths/Science usually preferred Minimum Marks Required None — open to all percentages Often 50–60% in 10th and 12th Maths Background Needed Not mandatory Strongly preferred Entrance Exam Not required Sometimes required (JEE, CUET, etc.) Duration 3 to 6 months 3 to 4 years Best Suited For Quick, job-ready skill building Long-term academic + research path If your goal is a job — not a degree — a certification course is the faster, more accessible route, and stream or marks do not block your entry. Who Exactly Can Apply — Stream-Wise Breakdown This is the part most students actually want clarity on. Here is exactly where each background stands: Your Background Eligible for Data Analytics Course? Where You Start Class 12 — Science (PCM/PCB) ✅ Yes Excel + SQL, fastest progression Class 12 — Commerce ✅ Yes Excel + SQL, strong fit Class 12 — Arts/Humanities ✅ Yes Excel basics, then SQL gradually BCom / BBA Graduate ✅ Yes Business analytics track BA / BSc Graduate ✅ Yes Statistics + Power BI focus BTech / BCA / MCA Graduate ✅ Yes Faster track — Python + advanced SQL Working Professional (any field) ✅ Yes Evening/weekend batch, career switch track The honest reality: general data-related courses prefer a graduation background in subjects like Mathematics, Computer Science, or Statistics for formal degree programs. But certification-based data analytics training works differently — it is built for beginners from any stream, which is exactly why thousands of Commerce and Arts graduates complete it successfully every year. Aptechlearninglko Do You Need a Maths or Coding Background? This is the single biggest myth stopping non-technical students from applying. Here is the truth: Skill Area Is It Required to Join? How Much You Actually Need Advanced Calculus ❌ Not required None Basic Statistics (averages, percentages) ✅ Helpful Class 10–12 level is enough Prior Coding Experience ❌ Not required Taught from scratch English Communication ✅ Important Conversational level is sufficient Logical Thinking ✅ Helpful Builds naturally through practice A comfortable understanding of concepts taught in 10th and 12th grade — like averages, percentages, and basic probability — is sufficient to start a data analytics course. You do not need to have scored well in maths to qualify. Aptechlearninglko Minimum Qualification Checklist for 2026 Use this simple checklist before you apply anywhere: Requirement Mandatory? Notes Class 12 Pass Certificate ✅ Yes Any stream, any board accepted Minimum Percentage ❌ No Most institutes do not enforce a cutoff Graduation Degree ❌ No Helpful but not compulsory for certification courses Laptop/Computer Access ✅ Recommended For practice; labs are usually provided at institutes Age Limit ❌ None Suitable for students, freshers, and working professionals alike If you meet just the first row, you are eligible to start. Aptech Learning Lucknow — Eligibility & Course Details For students and professionals in Lucknow and UP looking for a structured, beginner-friendly entry point: Feature Details Eligibility Class 12 pass or above, any stream Minimum Marks Required None Course Duration 3 to 6 months Batch Options Morning / Evening / Weekend Mode Offline — Mahanagar, Lucknow Tools Taught Excel, SQL, Python, Power BI, Tableau Placement Support Resume + Mock Interviews + Recruiter Referrals Contact +91 6386 119 566 Students from Commerce, Arts, BCom, BBA, and engineering backgrounds train together here — eligibility is never a barrier; only commitment to learning is. Frequently Asked Questions (FAQs) Eligibility Is Not the Barrier — Starting Is If you have passed Class 12 from any stream, you already meet the eligibility for a data analytics course. The only real requirement left is the decision to begin. 📞 Call / WhatsApp: +91 6386 119 566📧 Email: digilearninglko@gmail.com🌐 Website: aptechlearninglko.com📍 Address: First Floor, Above Radiance, 18 J Road, Near Midland Healthcare, Mahanagar, Lucknow

Explore More
Data Analytics Certification That Employers Actually Value in India — 2026

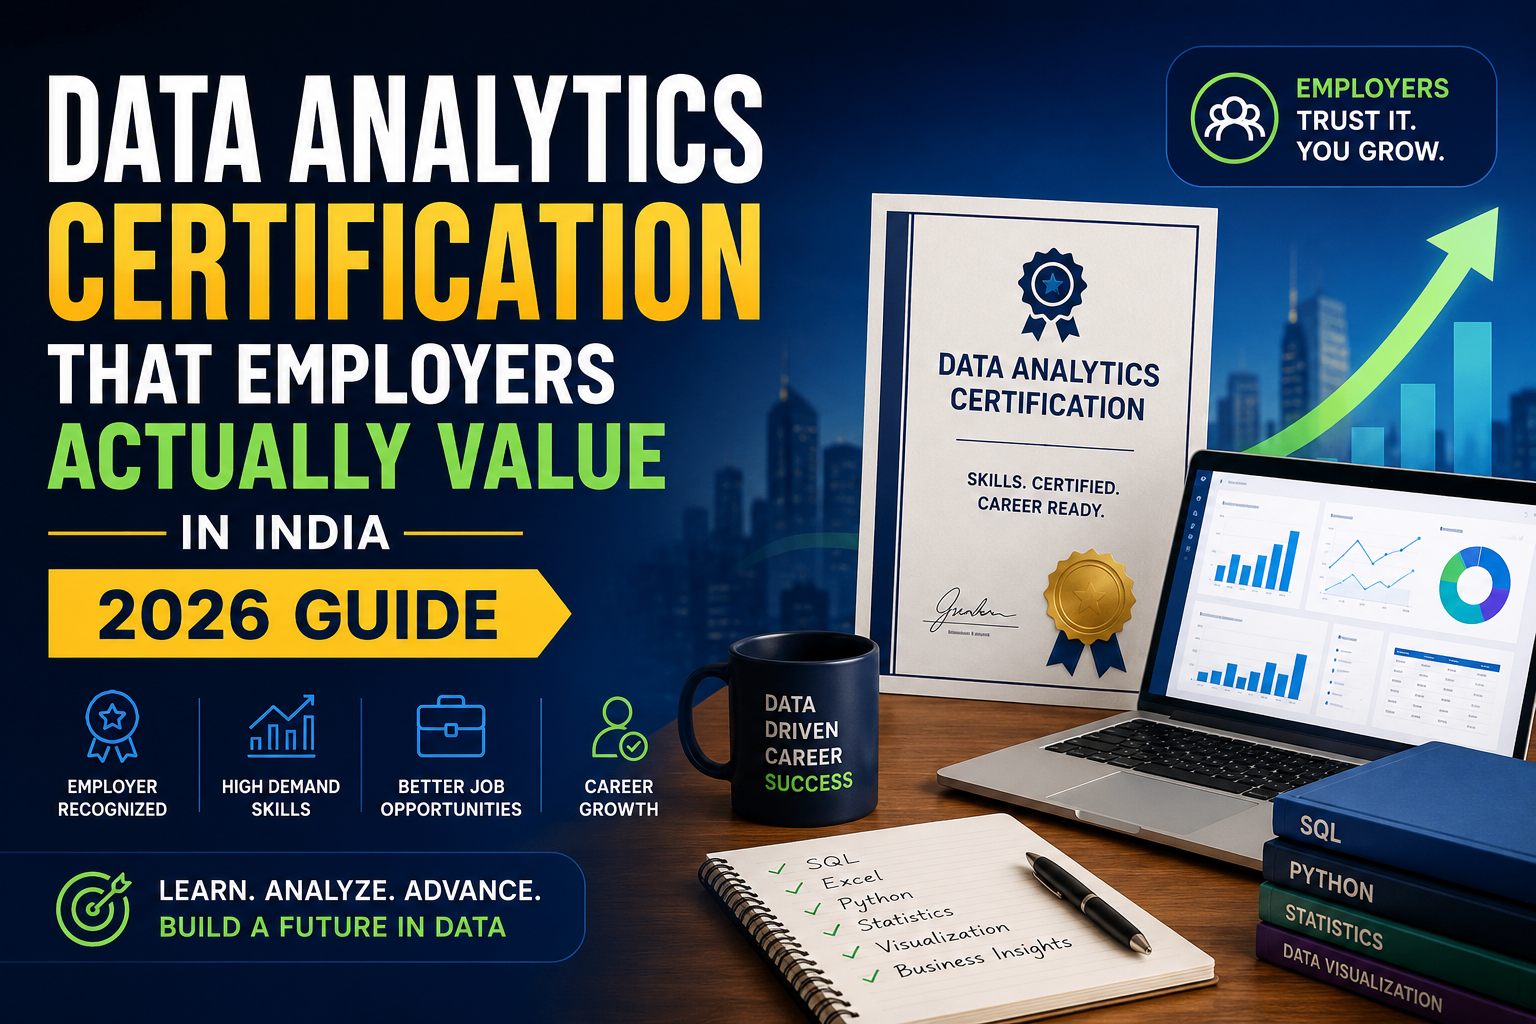
Data Analytics Certification That Employers Actually Value in India — 2026 Guide

Everyone wants a certificate. Very few people ask the harder question — does this certificate actually get me a callback? There is a real gap between what gets marketed online and what HR teams in India actually screen for. Some certifications carry genuine weight in interviews. Others sit unused on a LinkedIn profile, never once mentioned by a recruiter. This guide breaks down which is which, based on what is actually happening in Indian hiring right now. The Honest Truth — Certificates Alone Don’t Get You Hired Before comparing certifications, understand this one fact clearly: a 2025 survey of 111 hiring executives found that employers value practical skills over certificates alone. Aptechlearninglko What Employers Actually Check First Weight in Hiring Decision Portfolio projects (SQL, Python, dashboards) High — most decisive factor Certification (Google, IBM, Power BI) Moderate — supports the resume Degree / educational background Low to moderate, varies by company Communication skills in interview High — often the deciding factor A certificate gets you past the resume filter. Projects and communication get you the offer. Top Data Analytics Certifications — How Employers in India Rate Them Here is a direct comparison of the most recognized certifications and what they actually signal to Indian recruiters: Certification Best For Duration Employer Recognition in India Google Data Analytics Professional Certificate Complete beginners 3–6 months High — widely known, beginner-friendly IBM Data Analyst Professional Certificate Those wanting Python/SQL depth 4–6 months High — strong technical signal Microsoft Power BI (PL-300) Business intelligence roles 2–3 months Excellent — for BI/dashboard-heavy roles Institute certification (with live projects) Freshers needing local placement 3–6 months Strong — when paired with real projects CompTIA Data+ Vendor-neutral skill proof 2–3 months Growing — more common in MNCs CAP (Certified Analytics Professional) Senior/experienced analysts Ongoing High — but only for experienced professionals For absolute beginners in India, Google’s certification connects certified individuals with over 130 companies actively seeking entry-level data analysts through its employer consortium — a genuine advantage for first-time job seekers. Aptechlearninglko Online Certificate vs Institute Certificate — Which Actually Works Better? This is the real decision most freshers in Lucknow and UP are facing. Here is an honest comparison: Factor Online Certificate (Google/IBM) Institute Certificate (with placement support) Cost ₹7,000 – ₹20,000 ₹25,000 – ₹60,000 Live Doubt Resolution Limited, forum-based Instant, in-person Placement Assistance Generic job board access Resume + mock interviews + recruiter referrals Project Guidance Self-paced, less feedback Mentored, real business datasets Best Suited For Self-disciplined learners Freshers needing structured support Local Job Market Connection None Strong — direct local hiring network Online certificates build credibility. Institute training with live mentorship builds job-readiness. The strongest resumes in 2026 combine both. What Actually Increases Your Salary — Certification + Skill Depth Numbers matter more than brand names here. In India, certification can drive a 15 to 30 percent salary boost, translating to roughly ₹50,000 to ₹2,00,000 annually depending on skill depth beyond the certificate. But the catch matters just as much: certificate-only candidates see modest increases, while certificate plus strong portfolio candidates see 25 to 35 percent increases. AptechlearninglkoAptechlearninglko Profile Type Expected Salary Impact Certificate only, no projects Minimal — 5–10% boost at best Certificate + 2–3 real projects Moderate — 15–25% boost Certificate + projects + institute placement support Strong — 25–35% boost, faster hiring The certificate is the entry ticket. The projects and placement support are what actually move the needle on your salary. Why Aptech Learning Lucknow’s Certification Works for Freshers A recognized institute certificate, when backed by real projects and active placement support, holds genuine weight with local and remote employers. Feature Details Certification Aptech — recognized pan-India for over 3 decades Tools Covered Excel, SQL, Python, Power BI, Tableau Live Projects Compulsory, real business datasets Placement Support Resume building + mock interviews + recruiter referrals Eligibility Class 12 pass or above, any stream Duration 3 to 6 months Contact +91 6386 119 566 This certification pairs structured learning with the placement push that online-only certificates typically cannot offer. Frequently Asked Questions (FAQs) Choose the Certification That Actually Works for You The right certification is not the one with the biggest logo — it is the one paired with real skills, real projects, and real placement support behind it. 📞 Call / WhatsApp: +91 6386 119 566📧 Email: digilearninglko@gmail.com🌐 Website: aptechlearninglko.com📍 Address: First Floor, Above Radiance, 18 J Road, Near Midland Healthcare, Mahanagar, Lucknow

Explore More
About Image
Guaranteed & Certified

Students are joining

For our career programs like Full Stack Development, Data Science, Data Analyst, and Business Analyst, we guarantee to arrange job interviews for you with our 100+ hiring partners until you get placed

You will be trained by experienced faculty and top-notch mentors. Our senior mentors bring over 20+ years of real-world industry experience directly to your classroom

All our programs are conducted in 100% offline mode at our modern training center in Aliganj, Lucknow. We believe in face-to-face, hands-on learning for the best results

“Aptech Learning Center Mahanagar, founded by renowned educationists, provides high-quality IT education to empower Lucknow’s youth for competitive tech careers.”

Contact Info.

Aptech Learning Center, first floor, Above Radiance, 18 J Road, Near Midland Healthcare and Research center, Mahanagar Lucknow
+91 6386 119 566
digilearninglko@gmail.com

© 2025 Aptech Learning Center Mahanagar | All Rights Reserved | Designed and Developed By DigiGrow Solutions